Introduction to Single-Walled Carbon Nanotube Fluorescence Measurements
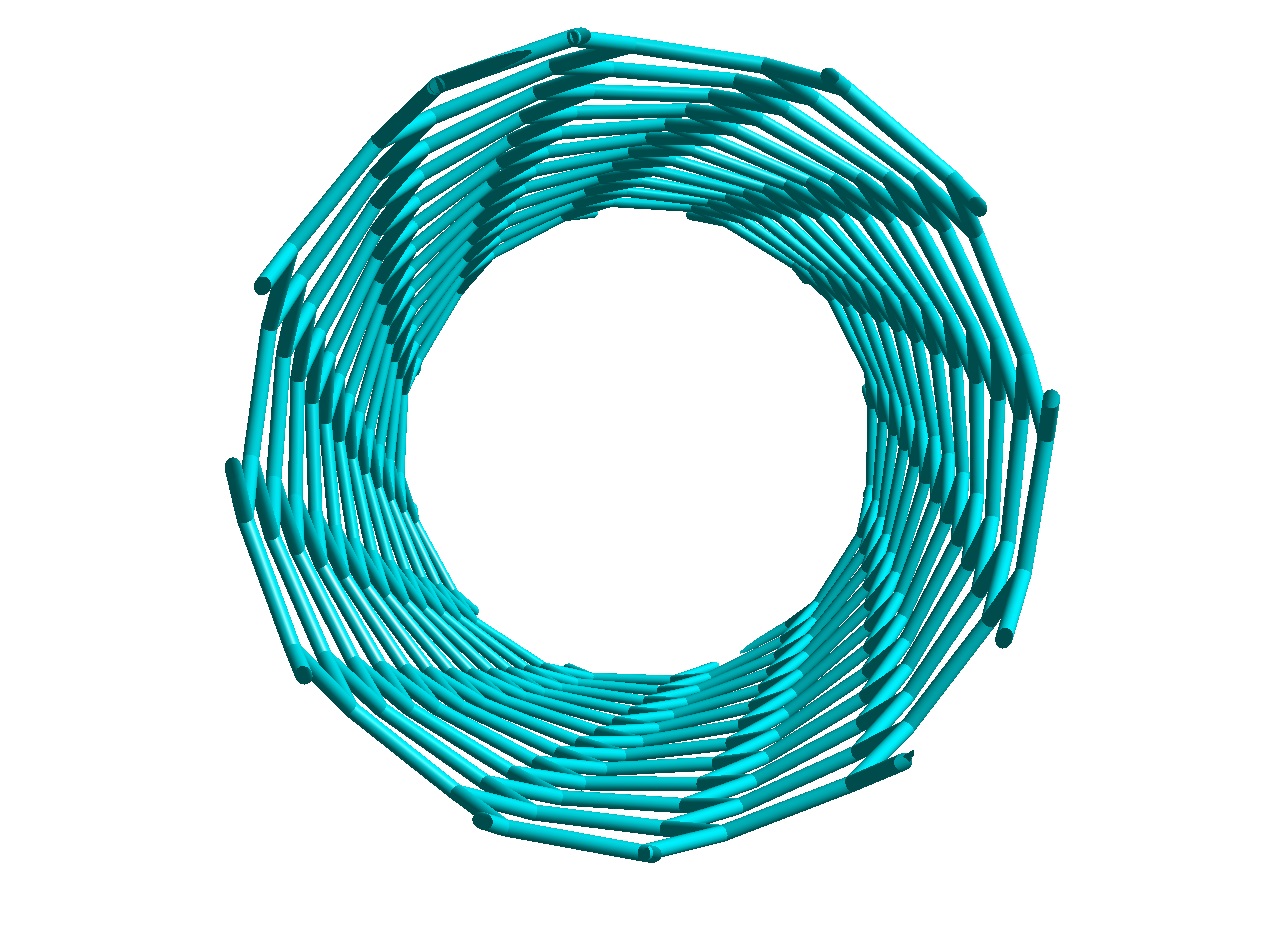
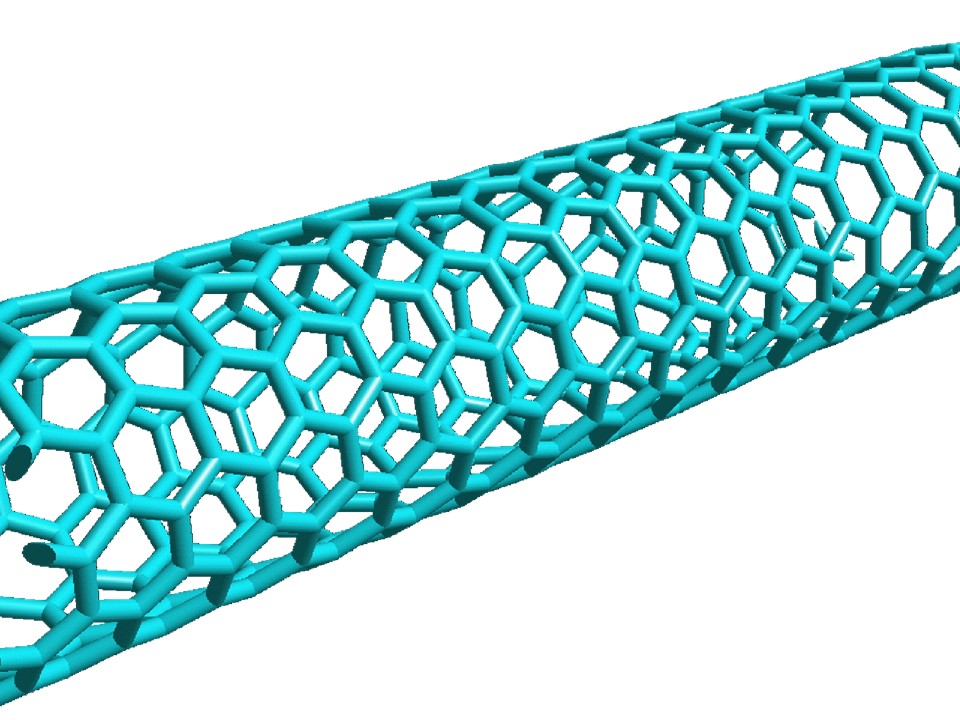
Single-walled carbon nanotubes (SWCNTs) have a graphitic structure in the form of a cylinder a single atom thick. These carbon cylinders can be formed with a variety of diameters and Multi-walled carbon nanotubes are composed of multiple concentric singlewalled carbon nanotubes. Short-wave or near-infrared fluorescence can be observed from a subset of single-walled and few-walled structures of carbon nanotubes.
|
End View |
Side View |
There are many different structures of single-walled carbon nanotubes. Each possible nanotube structure is labeled by two integers, (n, m), that uniquely define its diameter and chiral angle. Some nanotubes are metallic in electronic character, while others are semiconducting.
Metallic and Semiconducting nanotubes can be identified by their (n, m) designation.
Metallic nanotubes: the value n - m is evenly divisible by three
Semiconducting nanotubes: the value n - m is NOT evenly divisible by three.
Approximately 2/3rds of SWCNTs are semiconducting
The Semiconducting Nanotubes Fluoresce in the Near-Infrared!
Semiconducting and metallic nanotubes both absorb light in the visible region. The wavelength of visible light absorbed varies with each nanotube structure. Only semiconducting nanotubes will fluoresce in the near-infrared region. The wavelength of the near-infrared fluorescence emitted again varies with nanotube structure.
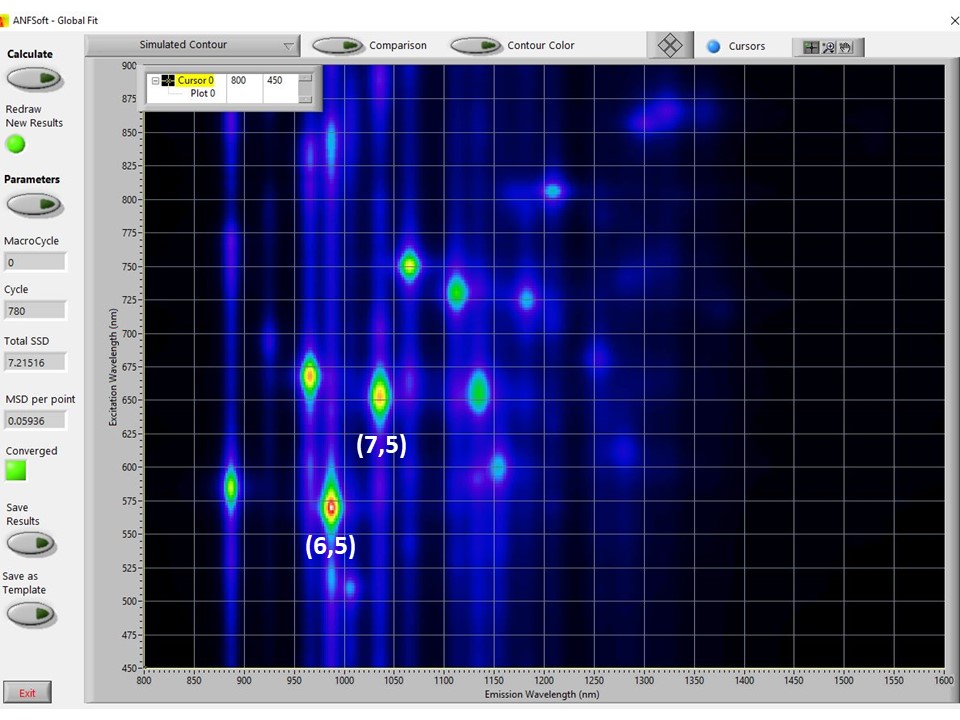
When we scan the visible excitation wavelength and capture the emission in the near-infrared we obtain a separate peak for each semiconducting (n, m) structure as shown in the contour plot below. In our NanoSpectralyzer systems, instead of scanning the entire visible absorption region we use 4 to 5 distinct laser excitation wavelengths and interpolate the regions in between using the latest scientific research data. This allows us to gather information about a SWCNT sample much more rapidly and also gives us access to data from more dilute samples that may be to dim to measure with the weaker lamp excitation typically used in scanning systems.
References: Band Gap Fluorescence from Individual Single-Walled Carbon Nanotubes, M. O'Connell et al., Science (2002) 297, 593, Structure-Assigned Optical Spectra of Single-Walled Carbon Nanotubes, S. M. Bachilo et al., Science (2002) 298, 2361, Dependence of Optical Transition Energies on Structure for SWCNT in Aqueous Suspension: An Empirical Katuaura Plot, R. B. Weisman and S. M. Bachilo, Nano Lett. (2003) 3, 1235
Application Note 1: Protocol for Preparing a Dispersion of SWCNT for Fluorimetric Analysis
Sample Preparation
Because SWCNT fluorescence is strongly suppressed by nanotube aggregation, fluorescing SWCNT samples must be prepared using effective dispersion procedures. Each laboratory should develop its own standard protocols appropriate for its range of samples and analytical needs.
In one recommended sample preparation method, a few micrograms of solid SWCNT is placed in a small glass vial to which are added several mL of a surfactant solution in D2O. Sodium dodecylsulfate (SDS), sodium dodecylbenzenesulfonate (SDBS), sodium cholate (SC), and sodium deoxycholate (SDOC) are common recommended surfactants. Brief agitation using an immersion-tip ultrasonic liquid processor (such as the Misonix XL2000) should then give a gray homogeneous suspension. For some cationic surfactants (especially SDS), one drop of 1 M NaOH should be added to ensure high and stable fluorescence intensities. The sample’s emission efficiency may be improved, if desired, by centrifugation to remove dense impurities and some nanotube bundles.
- Prepare a 1% by weight solution of SDBS (sodium dodecylbenzenesulfonate) in DI H2O or in D2O. (Use D2O to make spectral measurements at wavelengths beyond 1350 nm, where H2O begins to absorb strongly).
- In a small glass container (such as a scintillation vial), add ~10 micrograms of raw solild SWCNT material per mL of SDBS solution. (the quantity of SWCNT is not at all critical)
- Using a immersion tip ultrasonicator (with ~3 mm diameter tip), agitate the mixture at a power level of ~5 to 10 W. Place a water or ice bath around the container to prevent excessive heating. Optimal sonication time will vary with the type of sample and application. The liquid should begin to turn gray within seconds as nanotubes disperse, and it should continue to darken as the dispersion process continues. Excessive sonication may cause undesired shortening and/or damage to nanotubes.
- After dispersion, add a drop of NaOH solution to prevent acid-quenching of the SWCNT fluorescence. Fluorescence should be readily measurable from the sample at this point.
- Undispersed solids or visible small particles may remain after ultrasonic treatment. If their removal is desired, the sample can be subjected to moderate centrifugation at ~10,000 x g. This should give a supernatant layer free of visible particles.
- Note that oxidative or acid treatments of the SWCNT material are likely to cause sidewall chemical reactions that will permanently suppress SWCNT near-IR fluorescence. The most strongly emissive samples will be prepared from pristine, “unpurified” nanotube material.
|
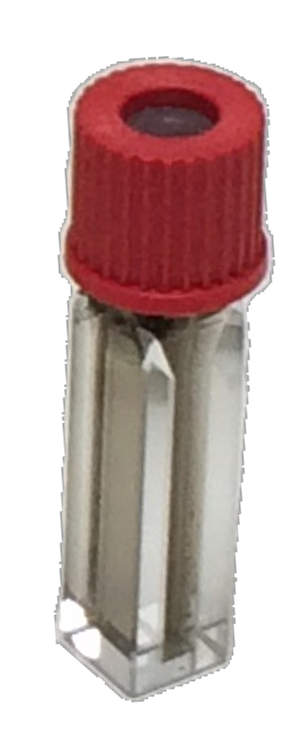
The NS3 provides unusual sensitivity for near-infrared emission. With high quality samples, it can record very good fluorescence spectra even from suspensions that appear perfectly clear to the eye. Fluorescent spectra have been acquired at ANF on samples with optical density of only 0.00001 (10-5) at the excitation wavelength. SWCNT-containing films or thin liquid samples with thickness down to a few micrometers may also be used in the fluorescence measurements (special cells or sample holder adapters are required). |
 |
Application Note 2: Determining (n,m) Compositions of Semiconducting Single-Walled Carbon Nanotubes (SWCNTS) in a Sample using a NanoSpectralyzer
Overview
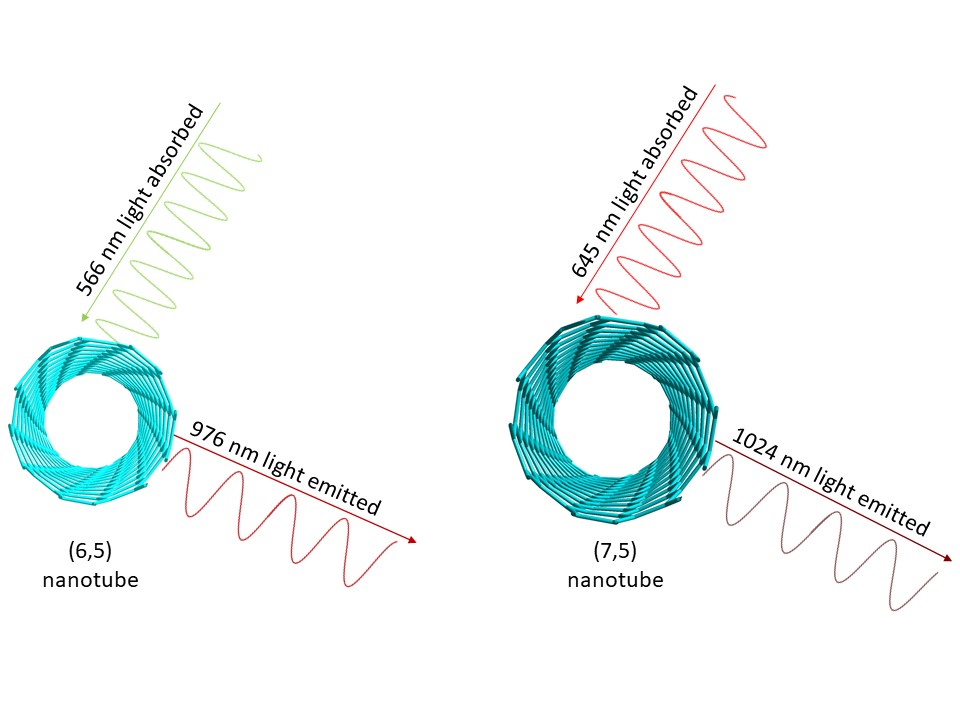
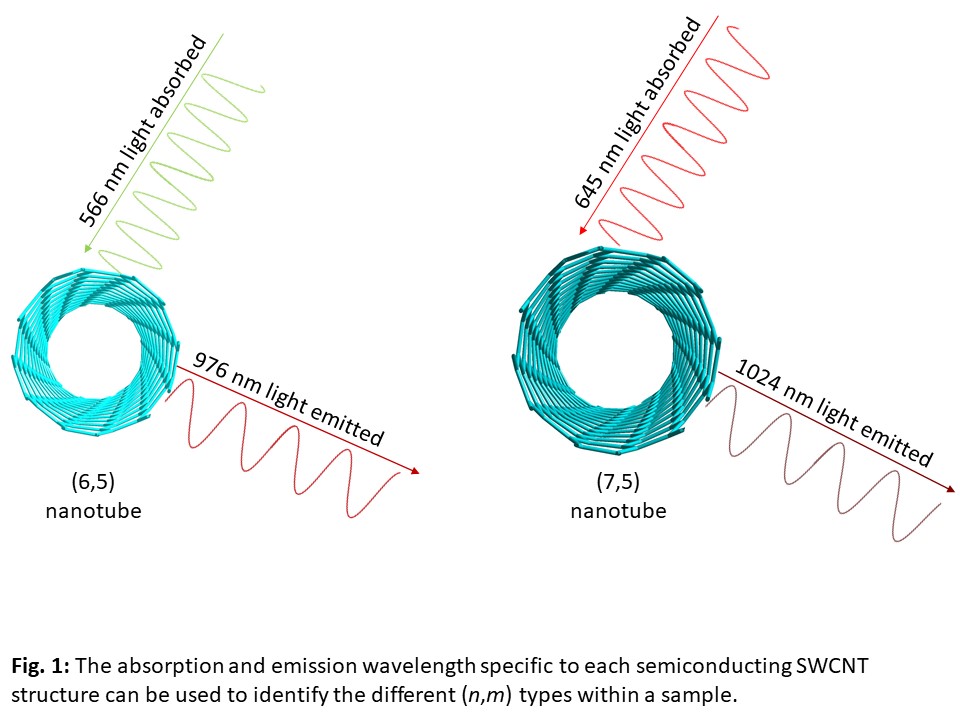
SWCNT samples almost always contain a number of (n,m) structural species, including semiconducting and metallic forms. The semiconducting SWCNT species present in a sample can be detected and identified by their fluorimetric signatures, which involve characteristic emission peaks in the near-infrared (NIR) and characteristic absorption peaks in the visible region. Figure 1 depicts two semiconducting SWCNT structures (denoted by two integers, (n,m)), that have absorption and emission wavelengths specific to each structure.
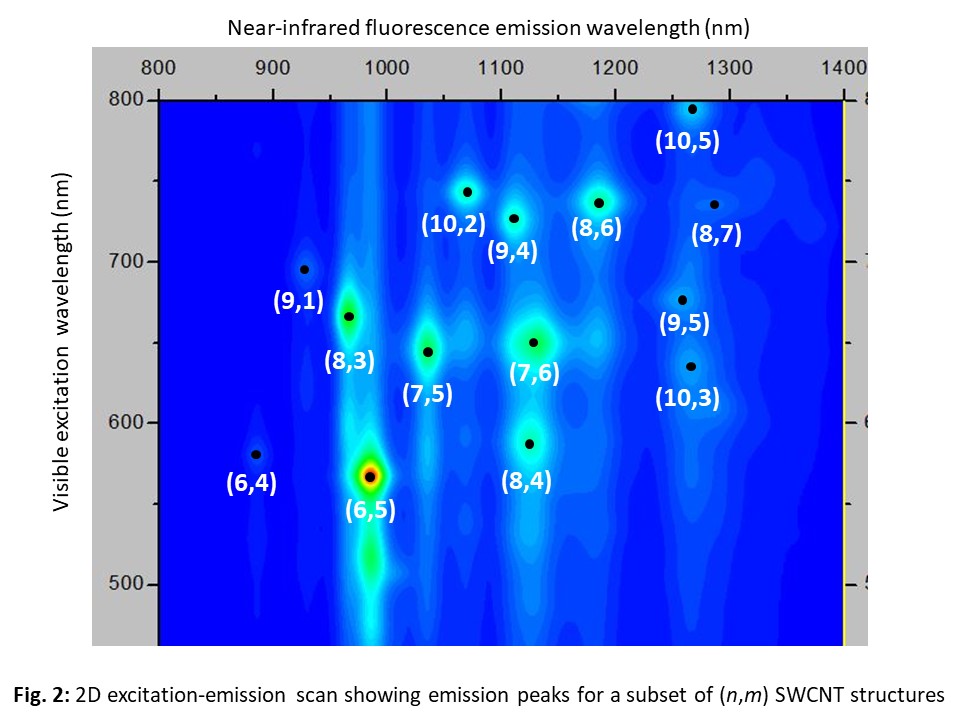
Two-dimensional excitation-emission scans were originally used to observe fluorescence peaks for the different semiconducting SWCNTs, and these features are used to qualitatively analyze the distribution of (n,m) species in a sample. Figure 2 shows a 2D scan with the peak positions labeled with the corresponding (n,m) semiconducting nanotube structure.
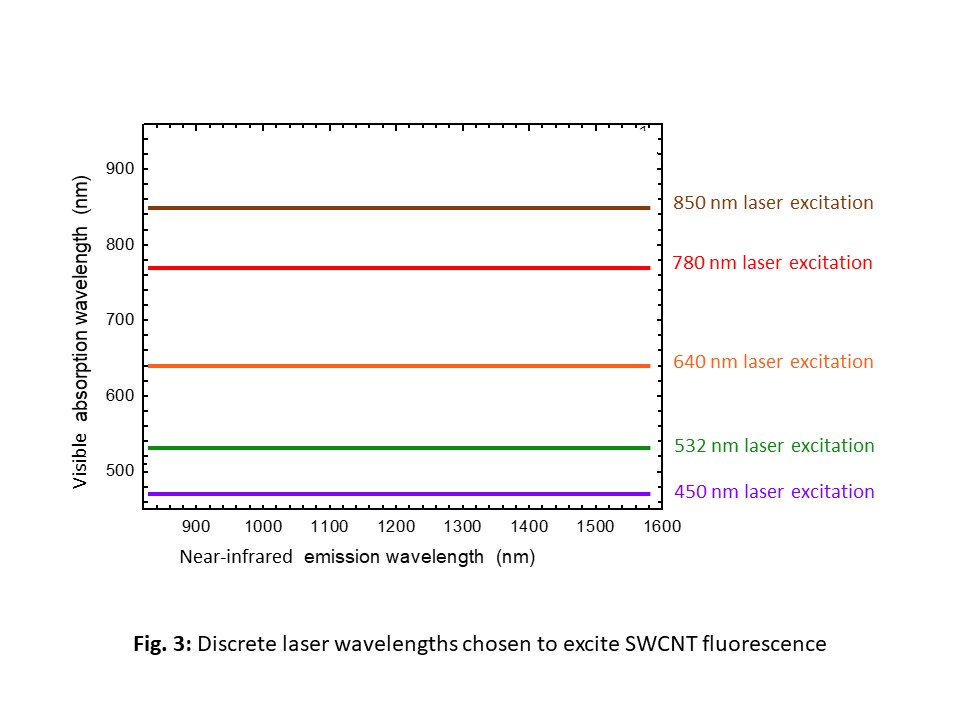
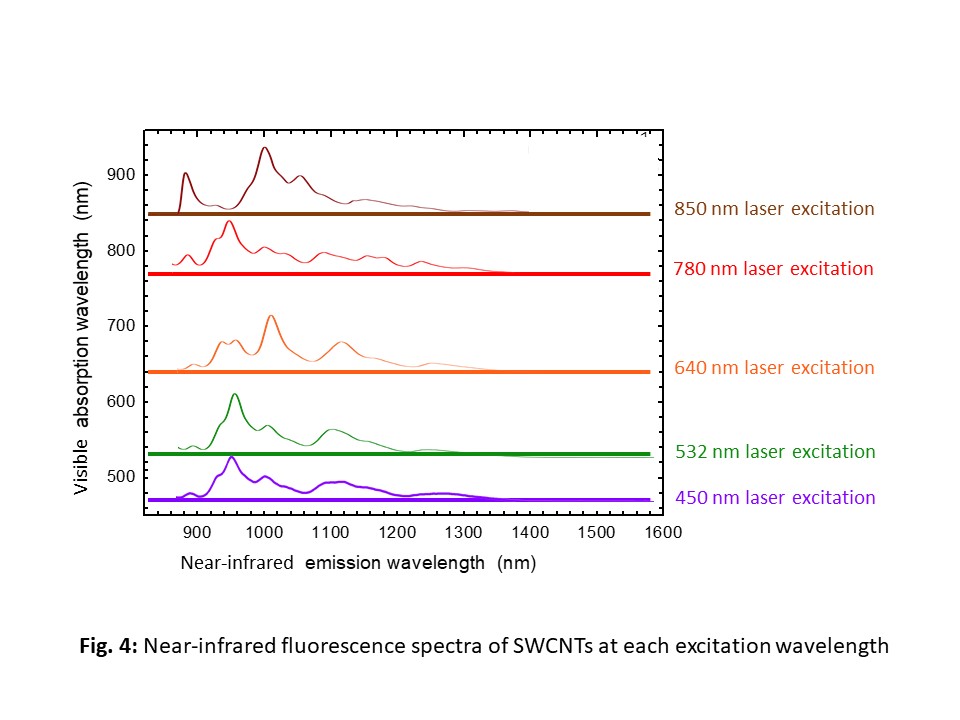
The continuously wavelength-tunable excitation light needed for such scans is available only by using a monochromator to filter the output of a broadband lamp. Unfortunately, the resulting lamp-based excitation beam is low in power and impossible to focus tightly. NanoSpectralyzers instead uses 4 to 5 higher power diode lasers with fixed wavelengths carefully chosen to excite a broad range of semiconducting SWCNTs. But how can many (n,m) species be detected using only 4 or 5 wavelengths that may not match most of their absorption peaks? First, each (n,m) species has a dominant excitation band with broad Lorentzian wings that extend far from the resonance peak. In addition, there are secondary excitation features from vibronic side-bands and perpendicular spectral transitions that greatly expand the range of wavelengths capable of inducing near-infrared emission. Finally the NanoSpectralyzer’s powerful excitation beams, efficient optical system, and sensitive near-infrared detector let it capture emission spectra with very high signal-to-noise ratio and large dynamic range, clearly revealing the emission features of less abundant or inefficiently excited species. Figures 3 & 4 show a typical selection of laser excitation wavelengths and the fluorescence emission obtained using those excitations.
 |
 |
Specialized analysis software integrated with the NanoSpectralyzer automatically uses advanced models of nanotube spectroscopy and photophysics to interpret the data and generate a semiconducting (n,m) inventory of a sample. This analysis takes only seconds, even for very dilute SWCNT samples. There are two levels of sophistication in finding the quantitative distribution of semiconducting (n,m) abundances in a SWCNT sample. The first is measuring and tabulating the near-infrared emission intensities (normalized to excitation efficiency and laser power) of the species identified in the (n,m) inventory described above. The NanoSpectralyze analysis software achieves this by careful global fitting of the emission spectra from all excitation wavelengths (example of a global fit shown in Figure 5).
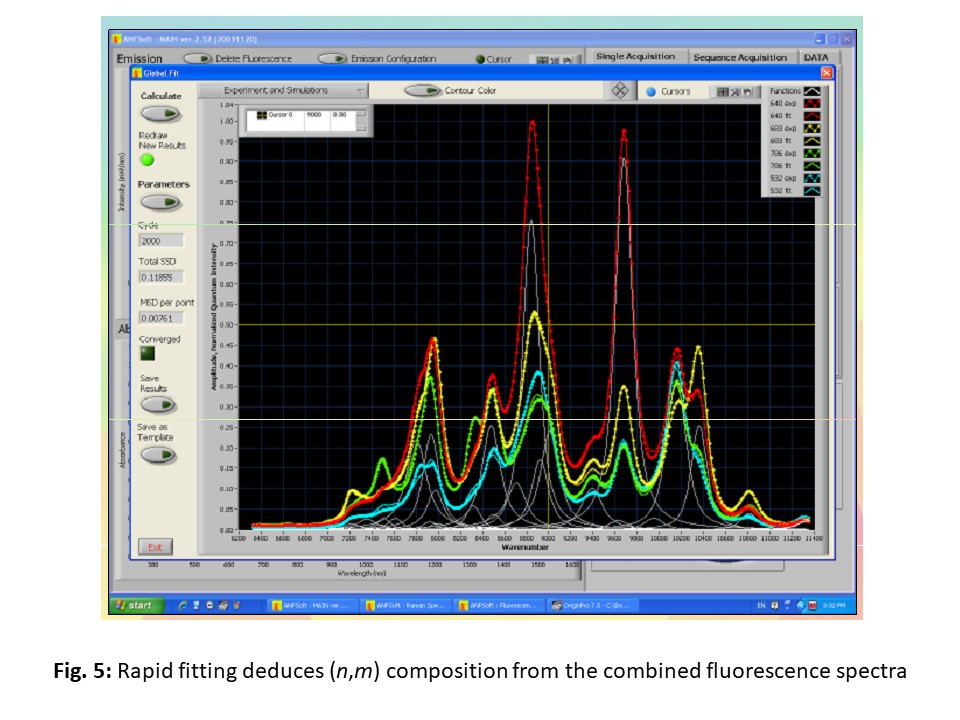
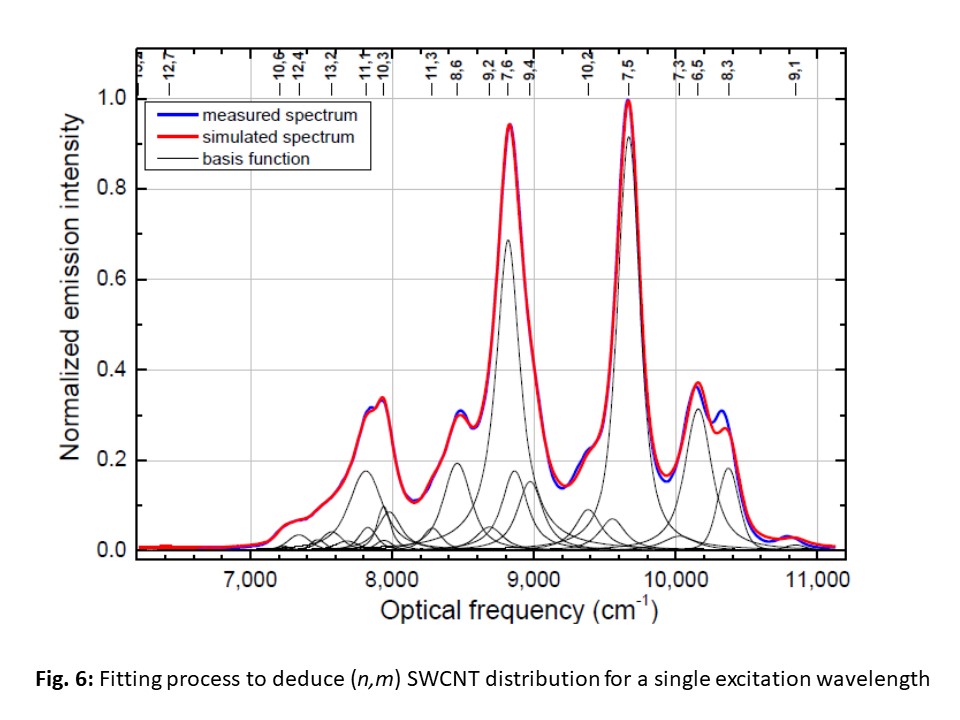
Each spectrum is simulated as a superposition of emission peaks from a large “basis set” of (n,m) species, with the relative species populations constrained to match among all three spectra (a single spectrum with basis functions is displayed in Figure 6). The simulation uses an advanced model that includes precise peak positions, widths, and shapes for each species’ excitation and emission spectrum.
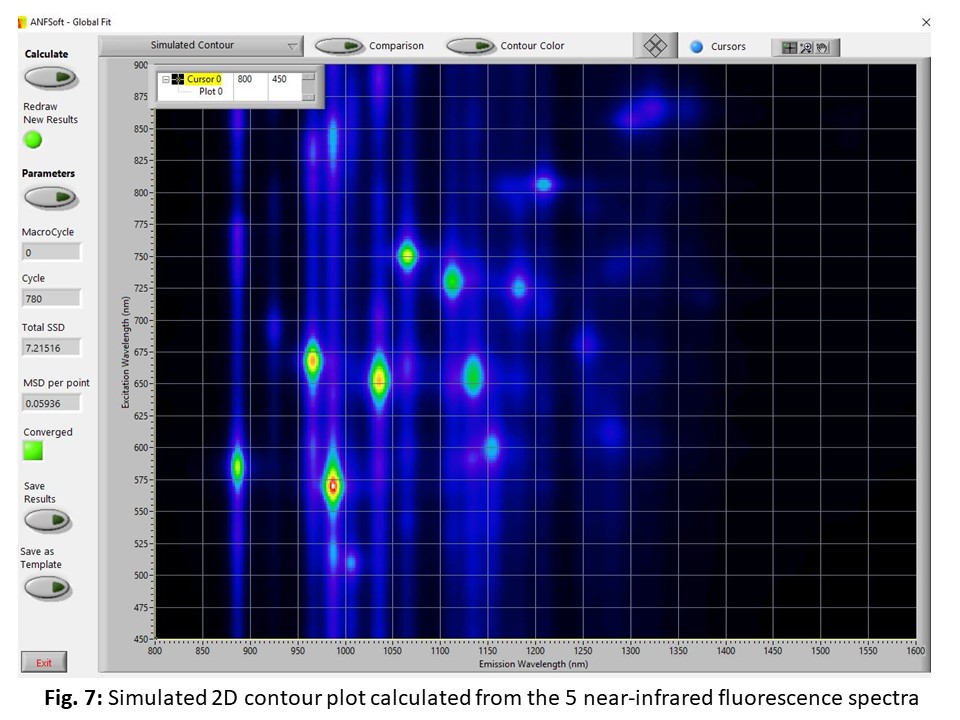
These parameters are held in surfactant-specific templates that reflect the minor spectral changes induced by different nanotube environments (Origin template files can be accessed on the Downloads and Links page under the Resources menu). Instrumental factors such as the wavelengths and powers of the excitation lasers are included to compensate for differences in excitation efficiency among the (n,m) species. Efficient algorithms allow quick computation of the fitting results. They give a distribution equivalent to that obtained from measuring peaks in a two-dimensional excitation-emission scan, but with the advantages of much faster data acquisition and higher sensitivity. In fact, the NanoSpectralyze softare has the ability to simulate the full 2D scan from the flourescence spectra obtained from the individual laser excitations as shown in Figure 7.
 The second level of quantitative interpretation goes beyond the assumption (implied above) that all (n,m) species give equal fluorescence signal strengths if they are present at equal mass concentrations. Instead, the (n,m) distribution deduced from the first level is adjusted using a set of correction factors that reflect the differing intrinsic fluorimetric brightness of different species. These (n,m)-specific factors are the product of absorption cross-section at the excitation peak multiplied by quantum yield for NIR emission. They are found from state-of-the-art calibrated photophysical measurements on individual SWCNTs. As future research findings suggest refinements in these correction factors, they will be promptly updated in revised versions of the NanoSpectralyze software. By applying the photophysical correction factors during fluorimetric analysis, the NanoSpectralyzer system provides a reliable (n,m) distribution showing the relative mass abundances of semiconducting SWCNT species in the sample. No other bulk method can provide such quantitative analyses.
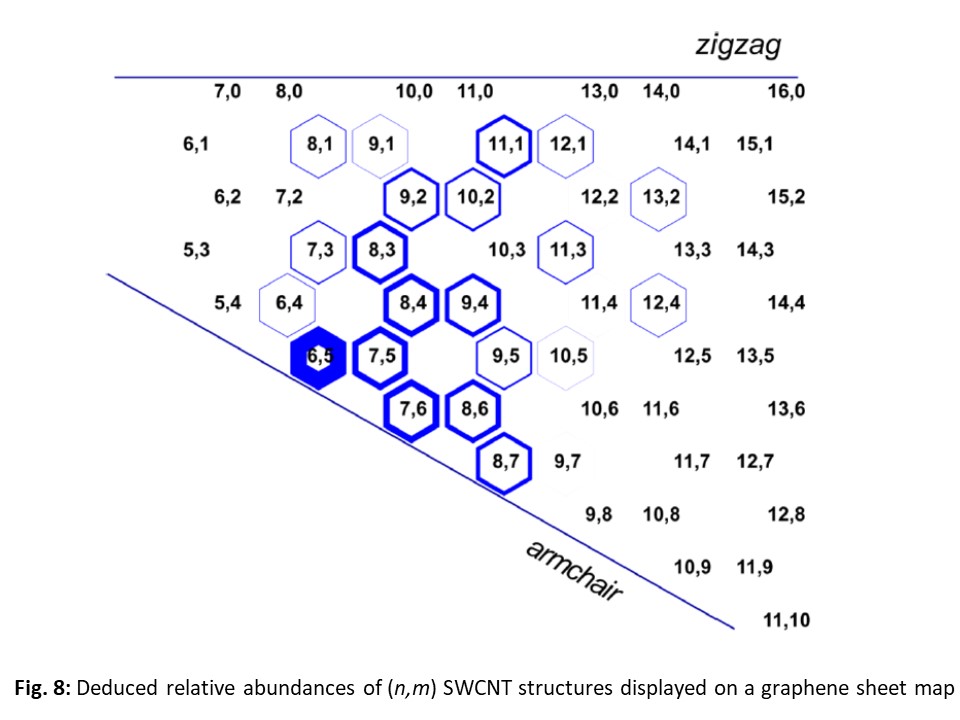
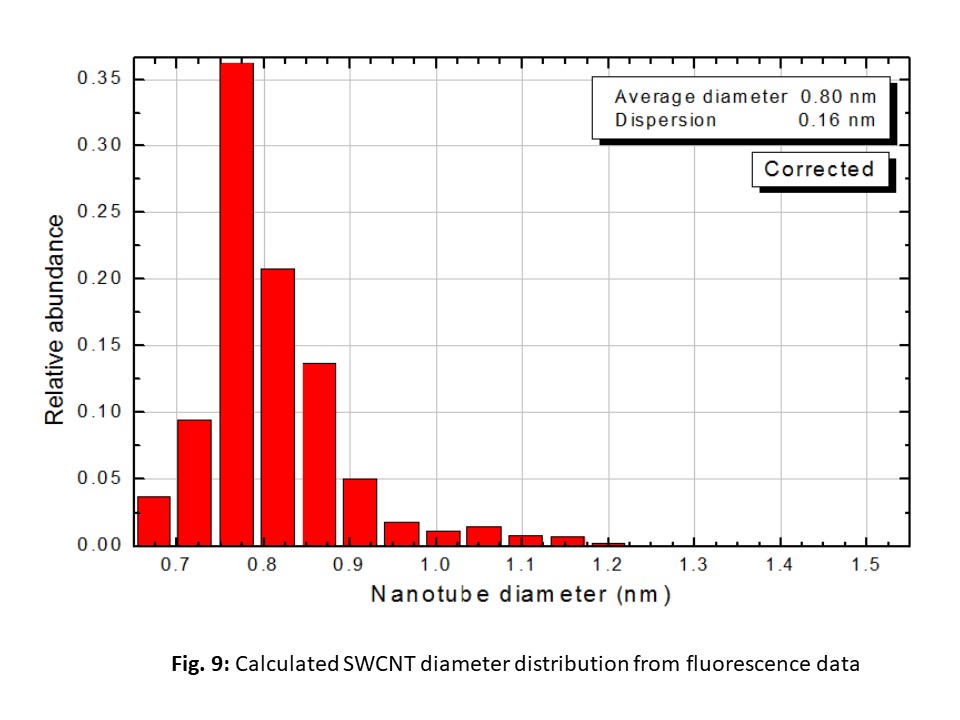
The (n,m) distribution deduced by measuring and interpreting the near-infrared emission spectra is displayed in automatically generated, publication-ready graphs such the graphene sheet map in which the line thickness of each hexagon is proportional to the deduced species abundance shown in Figure 8, and the diameter histogram computed from the abundance distribution shown in Figure 9.
 |
 |
References: Structure-Assigned Optical Spectra of Single-Walled Carbon Nanotubes, S. M. Bachilo et al., Science (2002) 298, 2361, Dependence of Optical Transition Energies on Structure for SWCNT in Aqueous Suspension: An Empirical Katuaura Plot, R. B. Weisman and S. M. Bachilo, Nano Lett. (2003) 3, 1235, Efficient Spectrofluorometric Analysis of SWCNT Samples, J. R. Rocha et al, Analytical Chemistry (2011) 83, 7431, Structure-dependent Fluorescence Efficiencies of Individual SWCNTs, D.A. Tsyboulski et al, Nano Lett (2007) 7, 3080
Application Note 3: Fitting Parameters Guide and Definitions for NanoSpectralyze Peak Fitting Software to Calculate Relative (n,m) Distribution in Fluorescence Single-Walled Carbon Nanotube Samples
Overview
A general approach to spectral fitting with a new sample is first to load the template intended for or most similar to that sample’s surfactant. A Quick Fit should be run to see how accurate a simulation is obtained with the default parameter values of that template. If improvements are needed, a Full Fit analysis should be run with some of the above parameters allowed to vary (the recommended parameters to vary and typical percent variations are shown in Table 1). As the fit quality improves, fix some of the parameters that had been varied and allow new ones to vary. Some iteration of this procedure may be needed, but it is often possible to reduce the MSD (mean standard deviation) value to ~0.005. Once a satisfactory high quality fit has been obtained, save the parameters as a new template that will reflect the environment and history of the analyzed sample. Subsequent analyses of similarly prepared samples can then be very quickly computed using this template, with little or no need for parameter variation.
The current version of the fitting software allows user choice of symmetric (Voigt) or asymmetric (Pearson) line shapes to simulate the main emission peaks. Pearson is generally recommended for the most realistic results. Note, however, that templates are specific to this choice: Voigt and Pearson templates are not interchangeable and the E11 Width and E11 Shape parameters are linked to the choice. Each template is automatically coded as Voigt or Pearson, and the value appears in the Fit Type text box in the lower left hand corner of the Fit Parameters window when a template is imported.
When analyzing samples grown or prepared through different processes, a subset of the fit parameters should normally be allowed to vary slightly to account for the effects of sample condition and environment. Table 1 below lists those parameters and the recommended variation limits (in % per fitting round) to enter into the Fit Parameters Dialog Box.
Table 1. Fit parameters suitable for user control, with recommended variation limits
|
Parameter Name |
Typical Variation % |
Notes |
|
E11 Position |
0.1 |
Accounts for spectral shifts from SWCNT environment |
|
E22 Position |
0.1 |
Accounts for spectral shifts from SWCNT environment |
|
E11 Width |
3 |
Accounts for environmental homogeneity differences |
|
E11 Shape |
6 |
Accounts for environmental homogeneity differences |
|
Excitation Profile |
5 |
May change with sample condition and environment |
The meanings of these fit parameters are described in the following paragraphs. The fitting process can be restarted from the last set of parameter values by select Calculate again on the Fit screen. In these subsequent fitting rounds, parameters are again freed to vary by the range specified in the Variation % fields. Therefore running five consecutive fitting rounds with a 10% allowed variation in some parameter can lead to a much larger cumulative variation of ~50%, which may be unrealistic. Keep this potential problem in mind and be conservative when setting variation limits. Note also that the fitting routine searches for a local optimum in a multidimensional parameter space. Decreasing the number of varied parameters will greatly accelerate convergence, and decreasing the range of allowed variation for those parameters that are well pre-determined will also speed the fitting computations. Because of the large number of parameters, a converged solution will not be unique. Reliability of the final results will be limited by the care taken in the fitting process and also by approximations in the spectral model used for simulation.
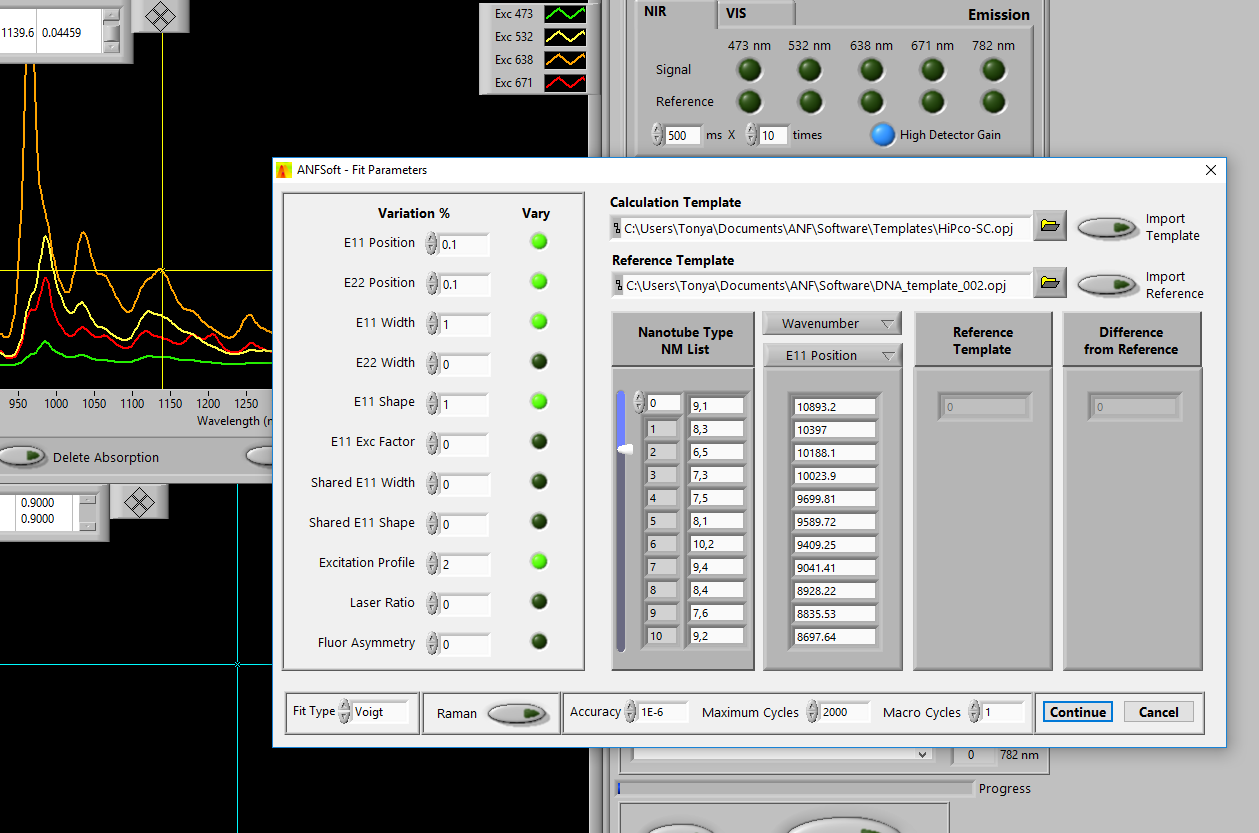
User-adjustable Fit Parameters:
E11 Position (typical adjustment range: ≤ 0.1%) is the set of (n,m)-specific frequencies, in cm-1, for the main emission peaks (first van Hove transitions). The array size is equal to the number of SWCNT types used in the fitting. There are an equal number of values for E22 Position, E11 Width, E22 Width, E11 Shape, E11 Exc Factor, and Solution Vector, as each of these is considered (n,m)-specific. E11 Position values can vary with SWCNT perfection, surfactant coating, other environmental conditions, or (sometimes) the sample preparation protocol. When using a set of frequencies that is appropriate for the relevant surfactant, only slight variations (within ~0.05-0.1%) should be permitted for E11 Position. Caution: larger tolerances may lead to fits that appear accurate but misidentify some peaks.
E22 Position (typical adjustment range: ≤ 0.1%) is the set of (n,m)-specific frequencies, in cm-1, for the peak absorption features (second van Hove transitions). Because these features are broader than emission peaks, their parameter values are somewhat less critical than the E11 positions and may be safely allowed to vary by ~0.1%.
E11 Width (typical adjustment range: ≤ 3%) is the set of (n,m)-specific individual peak widths (FWHM, in cm-1) for the emission features. During initial fitting of a sample without a refined template, it is recommended to use the Shared E11 Width parameter instead. This will prevent individual peak widths from assuming anomalously small or large values. After a rather refined fit has been obtained with Shared E11 Width, spectral fitting can proceed with individual width variations using the E11 Width parameters. Here, variations of ~3% per round may be safely allowed, but after a few rounds the values should be checked and corrected to avoid unreasonable broadening (most frequent problem) or narrowing of the component peaks. We recommend examining peak contours in the Simulated Contour Plot display (see Fig. 19) and being suspicious of width parameter for any peaks that do not look nearly circular in this display.
E11 Shape (typical adjustment range: ≤ 10%) If Voigt peak shapes are selected, the E11 Shape parameters are a set of (n,m)-specific ratios that describe the balance of Lorentzian and Gaussian components (widths) used to represent the emission line shapes. A value of 0 gives a pure Gaussian shape, and a value of 1 gives a pure Lorentzian shape. It is possible to allow variations of ~10% in these parameters, but a smaller range will accelerate the search for other parameters. Manual adjustment of these values after a few calculation rounds may be required to avoid “sticking” at unrealistic values of 0 or 1.
If Pearson peak shapes are selected, the E11 Shape parameters can have any positive whole number value. A value of 1 gives a Lorentzian base shape, whereas large values lead to a near-Gaussian shape. However, these Pearson peaks will be asymmetric, unlike Voigt peaks. Caution: if the simulation model is switched between Voigt and Pearson, major adjustments will be needed in the E11 Shape parameters and also in the E11 Width parameters.
Excitation Profile (typical adjustment range: ≤ 10%) is a set of common parameters used in modeling the vibronic structure of excitation spectra that are not available from empirical results (in the file Excitation Profiles in the ANFSoft folder). These parameters can be varied by up to 10% during exploratory fitting.
In addition to these parameters, there are others listed in the Fit Parameters Dialog Box that should remain fixed for normal fitting. The parameters below should be allowed to vary only with careful attention by experienced operators.
Normally Fixed Fit Parameters:
E22 Width (recommend 0%) is the set of (n,m)-specific widths (FWHM, in cm-1) for the E22 absorption peaks. By default, these values are found from a research-based empirical expression included in the program.
E11 Exc Factor (recommend 0%) is a set of parameters that accounts for the possible excitation of E11 vibronic sidebands by the lasers.
Shared E11 Width (typical adjustment range: ≤ 20%) is a single peak width (FWHM, in cm‑1) used to describe all of the emission features (as an alternative to (n,m)-specific peak widths). Selecting a variation in this parameter disables variations of the E11 Width parameter set described above. A 20% variation range can be allowed in exploratory fitting. The use of Shared E11 Width should be restricted to preliminary fitting of unusual samples for which a standard template is not adequate.
Shared E11 Shape (typical adjustment range: ≤ 10%) is a single ratio of Lorentzian to Gaussian character used to model all of the peaks in the emission spectrum (as an alternative to (n,m)-specific peak shapes). Selecting a variation in this parameter disables variations of the E11 Shape parameter set described above. This parameter can be varied rather widely during exploratory fitting but should then be stable within sets of similarly prepared samples.
Laser Ratio (typical adjustment range: ≤ 5%) holds an array of NL relative parameters (where NL is the number of excitation lasers) describing the combined laser powers and optical efficiencies at the excitation wavelengths. After fitting, the first value is set equal to 1. Once initially optimized, the Laser Ratio should remain stable for long periods, since it represents a fixed instrumental parameter. However, when analyzing relatively concentrated samples or samples of non-standard geometry, the parameter may need adjustment to account for differing penetration depths of the excitation beams in the sample cell. A variation limit of ~5% per fitting round is recommended using an established template, but a limit of 20% or higher can be used for a new template when the array begins with a set of values equal to 1.
Fluor Asymmetry (recommend 0%) applies when the Pearson peak model is selected under Fit Type in the bottom row of the Fit Parameters dialog box. The parameter describes the asymmetry of the main emission peaks and should remain at its nominal value of 0.3 except in special circumstances.
Solution Vector is a result, not a user-selected parameter. It shows the set of deduced (n,m) concentrations found through the fitting process. These are the values transmitted to Origin and used to prepare the displayed results graphs and worksheets.
Application Note 4: Assessing Single-Walled Carbon Nanotube Dispersion Quality through Fluorescence & Absorption Measurements
Dispersed semiconducting single-walled carbon nanotubes (SWCNTs) can emit short-wave or near infrared (SWIR or NIR) fluorescence if they are free of growth defects, have not undergone sidewall chemical reactions, and are individually suspended rather than aggregated into bundles with other nanotubes. The measured fluorescence intensity from an SWCNT dispersion therefore depends not only on optical excitation power and nanotube concentration, but also on the sample’s “quality."
Total Fluorescence Power Measurement
To allow simple quantitative assessment of dispersion quality, the NanoSpectralyzer automatically measures and reports the total (spectrally integrated) SWIR fluorescence power from the sample for each excitation wavelength, as shown in the first row of the box below:

These values for total emission power allow one to compare a set of related samples (prepared with the same surfactant and equivalent sources of SWCNTs) to find the relative concentrations of disaggregated pristine nanotubes that they contain.
Sample Quality Index (Emission Efficiency)
The second row in the box shows the spectrally integrated fluorescence emission values after they have been adjusted to account for the sample’s fractional absorption of excitation light. These Efficiency values can be viewed as uncalibrated quantum yields that provide a figure of merit for short-wave infrared “brightness.” Efficiency values are highest for the purest and most completely dispersed samples because excitation light is absorbed not only by the emissive species (pristine disaggregated SWCNTs), but also by non-emissive components (imperfect nanotubes, bundled nanotubes, and impurities). The Efficiency values therefore provide a sensitive quality index. Measured values of this index can be 10,000 times higher for an excellent SWCNT dispersion than for a poor one.
Dispersion Stability
The most sensitive symptom of aggregation in an SWCNT dispersion is loss of fluorescence emission.
This occurs with the formation of small SWCNT bundles, and is detectable by fluorimetry far in advance of visible flocculation. To check the stability of a SWCNT dispersion, simply place the a sealed cell containing the sample into the NanoSpectralyzer and use the Sequence Acquisition mode to measure its fluorescence spectrum with one excitation wavelength at appropriate time intervals (e.g. once per hour during an overnight run). Stable dispersions will show no changes in fluorescence emission signals during such runs, whereas unstable dispersions will decrease in emission.
Technical notes:
- Total Power and Efficiency values depend on excitation wavelength and on the (n,m) composition of the sample. Quantitative comparisons are valid only among samples with the same (n,m) composition, excited at the same wavelength.
- The NanoSpectralyzer performs fluorescence measurements using a very short effective path length, minimizing distortions from the inner filter effect. To obtain reliable Efficiency values, the sample’s absorbance at the excitation wavelength should not exceed 1 for a 1 cm pathlength.
Application Note 5: Vertical Translation Option for Density Gradient Sorted Samples
The vertical translation option is available to add to any of our NanoSpectralyzer models (NS1, NS2, or NS3). It allows for the controlled motion of the sample in the vertical direction (45 mm range). In NanoSpectralyzers equipped with the vertical translation option (VTO), the sample cell holder is mounted on a vertical translation stage driven by a computer-controlled stepper motor. This allows automatic scans of fluorescence, absorption, and Raman spectra as a function of position in the sample cell, using the Sequence Acquisition tab of the Main control screen. Such spectral maps are particularly valuable for in situ characterization of layered contents in centrifuge tubes used for density gradient ultracentrifugation sorting of SWCNT samples. The VTO cell holder is designed to accommodate centrifuge tubes with outer dimensions of 13 x 51 mm or 14 x 89 mm (diameter x height), in addition to conventional square 12.5 x 12.5 mm spectrophotometer cells.
|
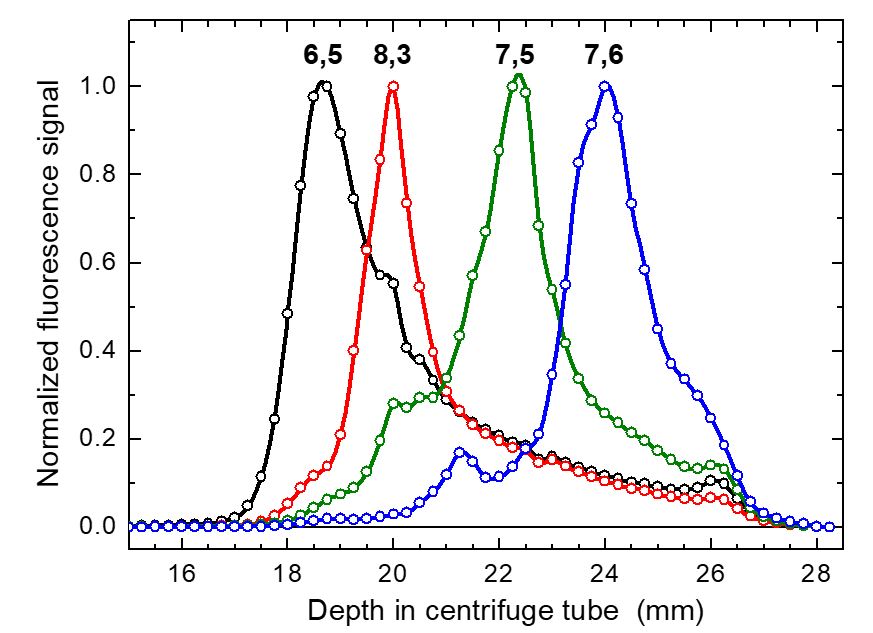
One of the most promising methods for purifying and sorting SWCNTs is density gradient ultracentrifugation (DGU). An aqueous surfactant-suspended SWCNT sample is placed into a centrifuge tube filled with a medium of spatially varying density. Iodixinol is commonly used as the high density water-soluble component in these preparations. After extended high speed centrifugation, it is found that the SWCNTs become spatially stratified and separated according to physical properties. Proper choice of surfactant and density gradient conditions allows even individual (n,m) species to be segregated into distinct layers. Careful fractionation of the centrifuge tube contents then gives structurally sorted SWCNT samples that are extremely useful for a number of applications. A key step in the delicate optimization of DGU parameters (density profile, surfactant choice, centrifugation speed, centrifugation time, etc.) is analyzing the compositional profile of the centrifuge tube after a run. Until recently, this has required painstaking layer-by-layer fractionation of the tube’s contents into many small samples, followed by spectrometric analysis of each fraction to identify its SWCNT composition. Now, however, the NanoSpectralyzer can perform this analysis quickly, conveniently, and noninvasively in the intact centrifuged sample. |
|
Method
NanoSpectralyzers use coherent and tightly focused laser beams to excite fluorescence from semiconducting SWCNTs. The dimensions probed in the sample are therefore very small. In addition, the NanoSpectralyzer optical design allows fluorescence measurements from cylindrical as well as conventional (rectangular) sample cells. So with a simple adaptation of the sample NanoSpectralyzer sample cell holder, one can use a 14 mm diameter centrifuge tube (compatible with SW41 rotors) as the sample cell. Fluorescence data are acquired in situ, right through the wall of the undisturbed centrifuge tube. Another minor option allows vertical translation of the centrifuge tube relative to the optical axis. Scanning the tube position gives near-IR fluorescence spectra with sub-millimeter vertical resolution. At each vertical position, spectra can be acquired using all three excitation wavelengths and then automatically analyzed to provide a full (n,m) composition map as a function of depth in the tube. This method offers far greater speed and spatial resolution than post-fractionation analysis. The NS1 can also measure absorption spectra as a function of vertical position to monitor non-emissive sample components.
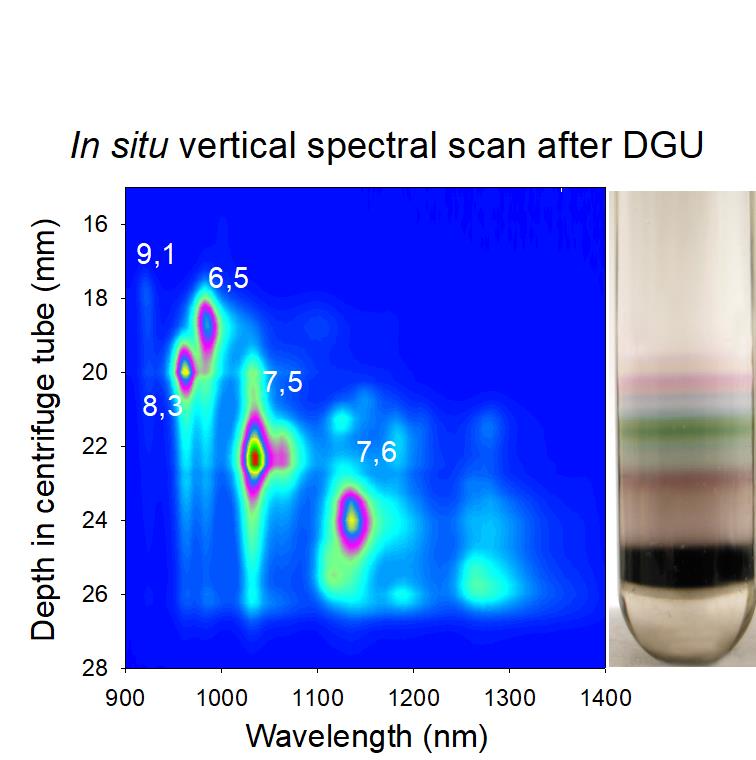
Example data
This contour plot shows emission intensity as a function of wavelength and vertical position in a DGU centrifuge tube. Data collection time was only a few minutes. Although this plot represents emission using only one of the three excitation lasers in the NanoSpectralyzer, it allows simple identification of the major (n,m) species at each vertical position and accurately reveals the extent of physical separation among these species. This plot can also guide fractionation efforts by showing the exact depths from which to collect each species of interest.
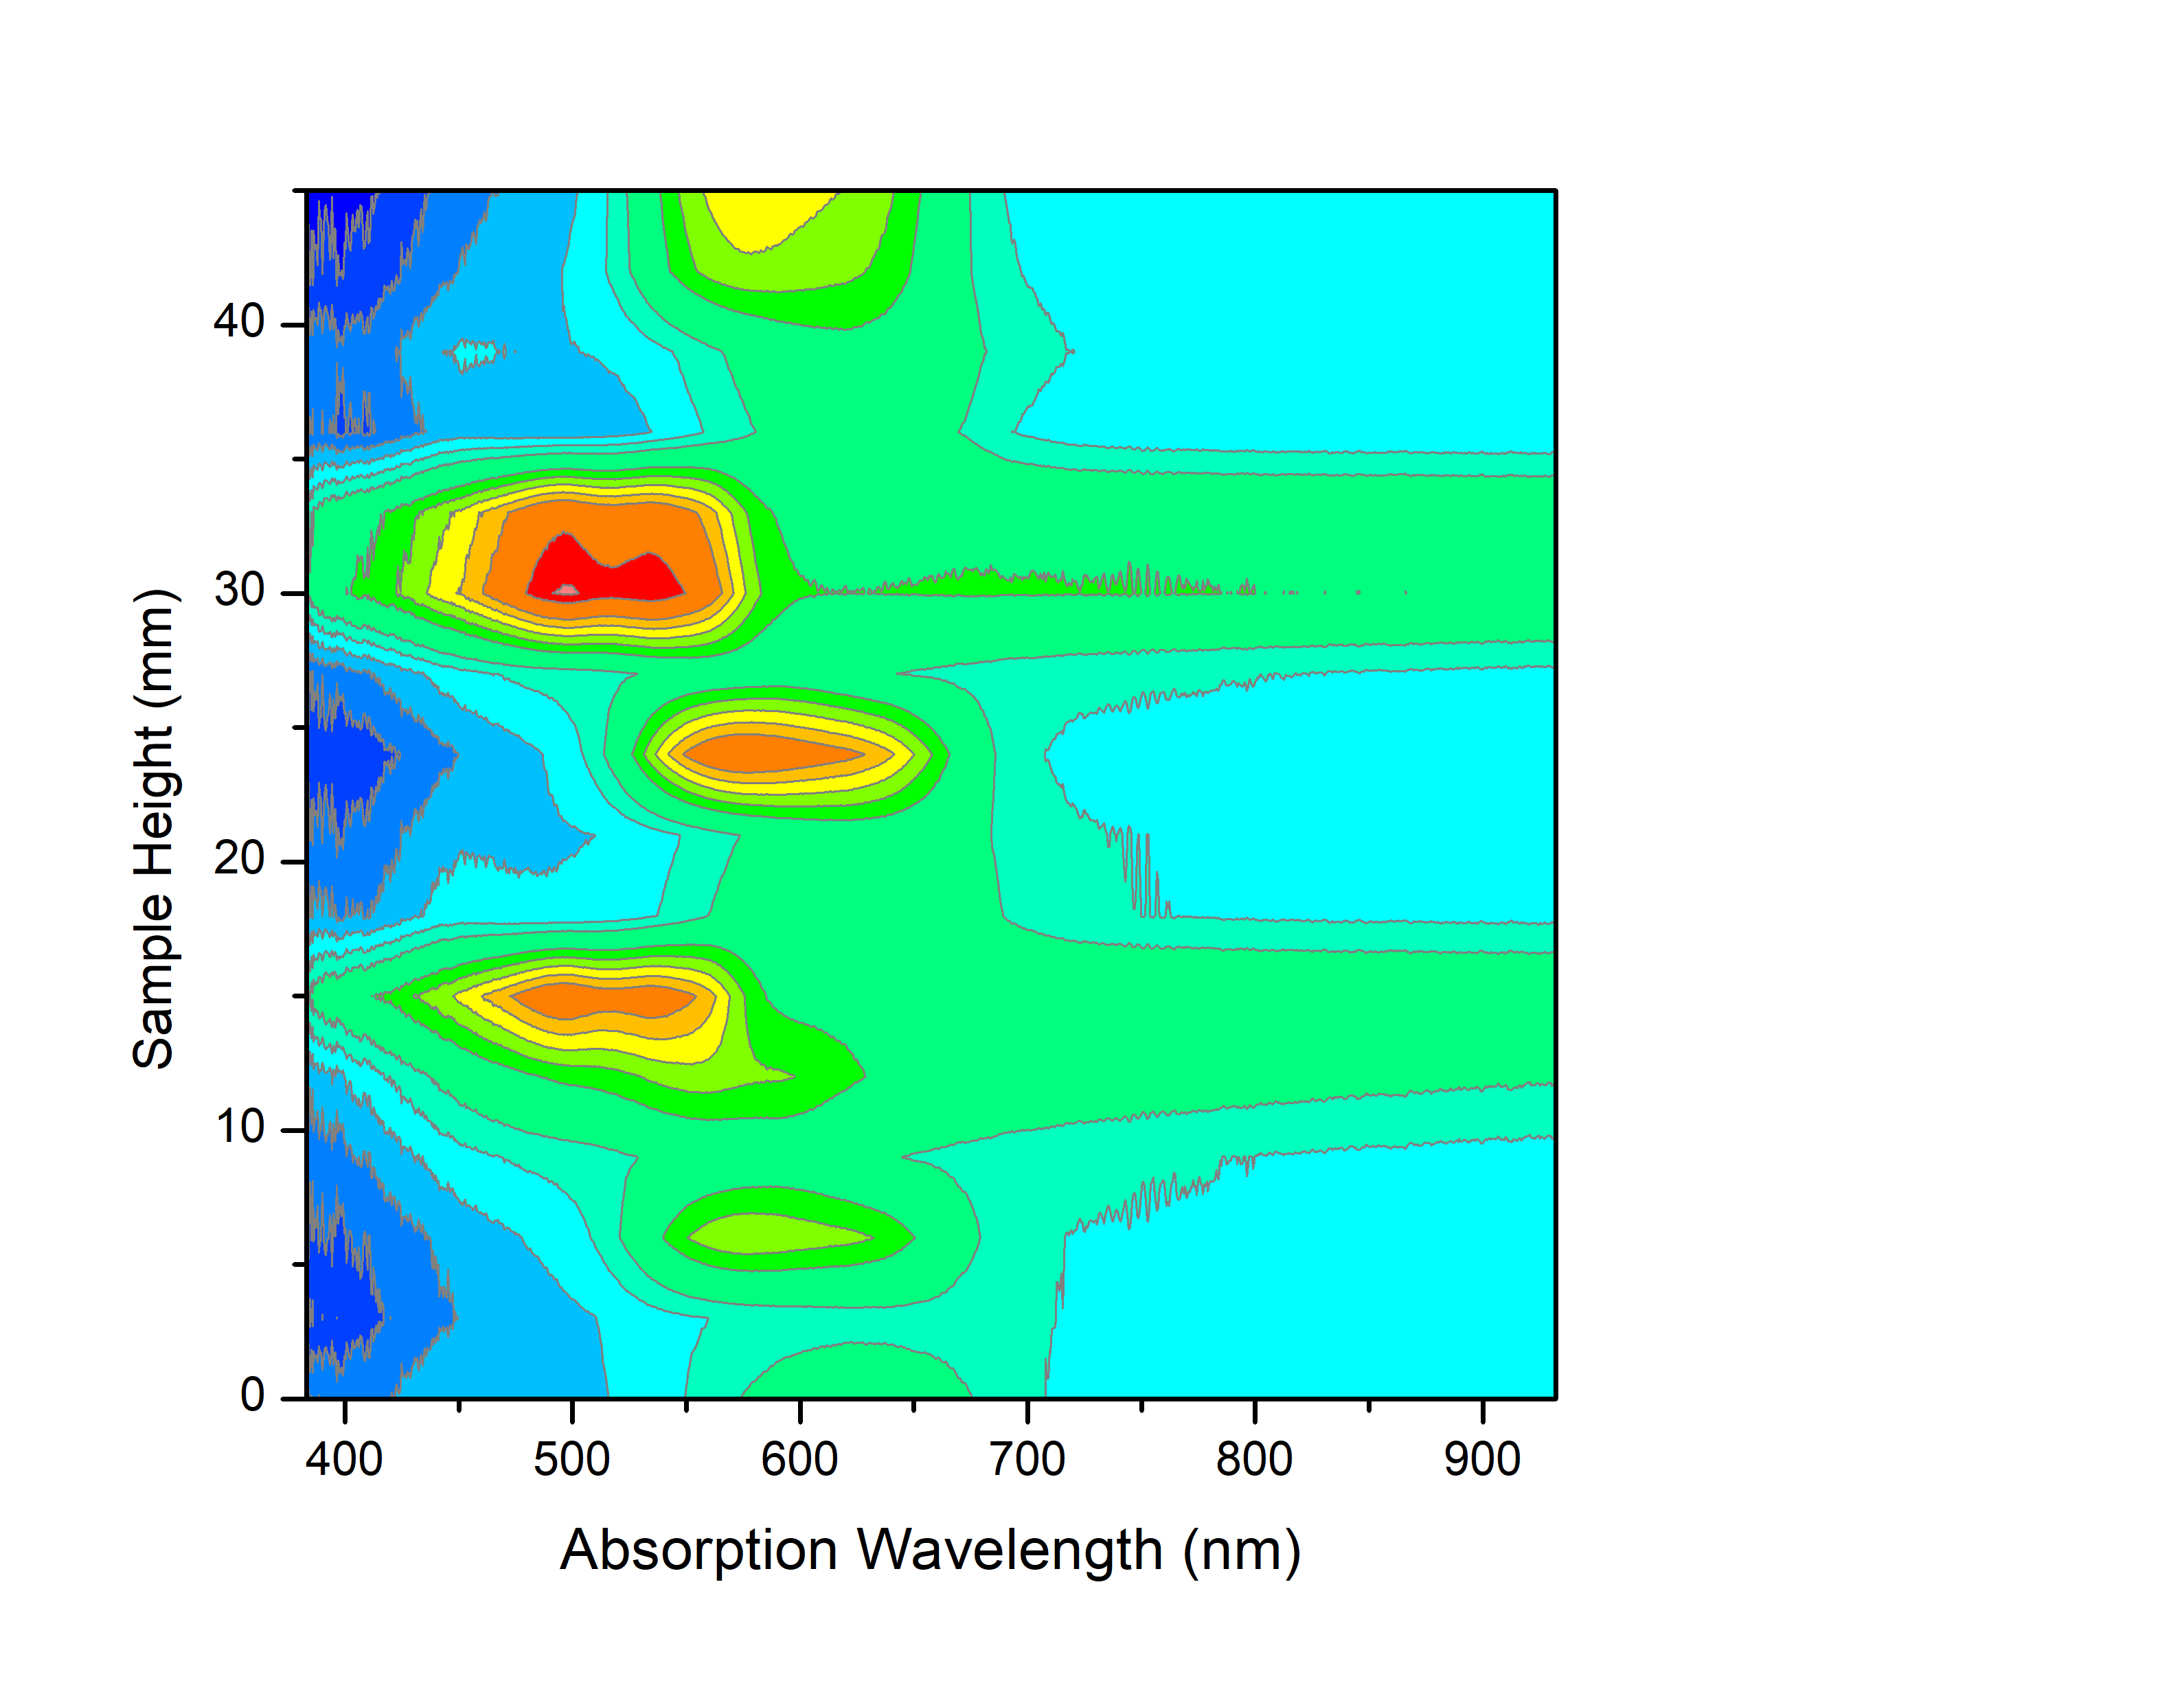
Additionally, the vertical translation option is not restricted to fluorescence data. Below is shown a contour plot of the visible absorption data for a glass tube with stripes drawn on it using different color markers as the glass tube is scanned vertically.
